At Open Data Services, we help organisations publish high quality, open and standardised data. One thing we’ve learned along the way is the importance of helping people to visualise that data clearly and effectively at every stage of the publishing process.
For some organisations, publishing and maintaining open data can be daunting. Although publishing open data shares many similarities with publishing documents, it’s difficult to “proof-read” JSON or XML files before sharing them with the world.
This problem can easily be addressed by supporting people to preview their data before they publish. By this, we mean giving people ways to view and visualise their data in order to check for the grammatical, sensical or even spelling mistakes they would look for in other publications. The difference here is that we’re looking for formatting, number and date issues, alongside how the data appears when aggregated.
Case study: d-portal and d-preview
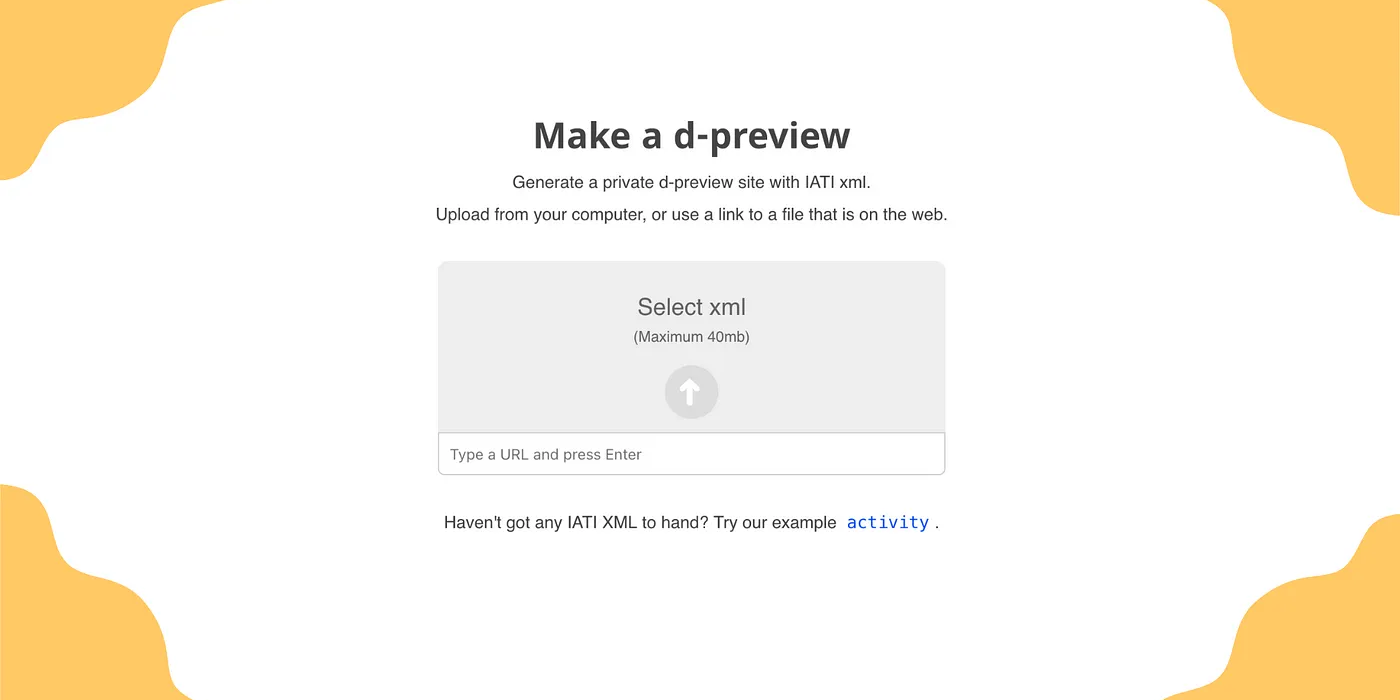
With this specific use case in mind, in March 2021 we launched d-preview, a tool that helps organisations visualise data they’re preparing to publish with the International Aid Transparency Initiative (IATI) Data Standard. IATI is a global initiative to improve the transparency of development and humanitarian resources and their results to address poverty and crises.
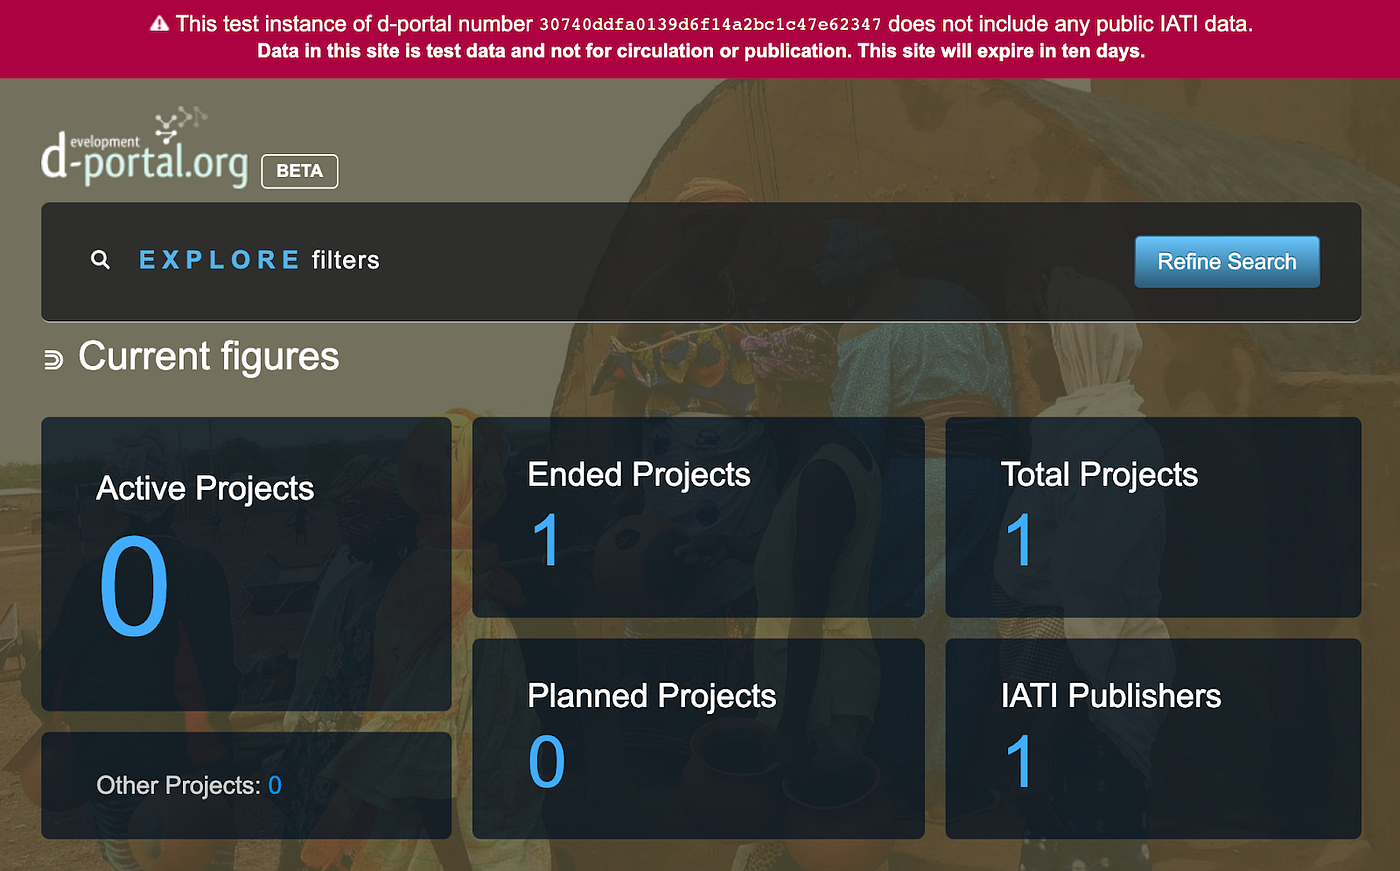
d-preview built on top of d-portal, a website that already existed, that visualises all published IATI data. For example, using d-portal you can see how many aid projects have been published as IATI data, the status of these projects, and the number of IATI publishers.
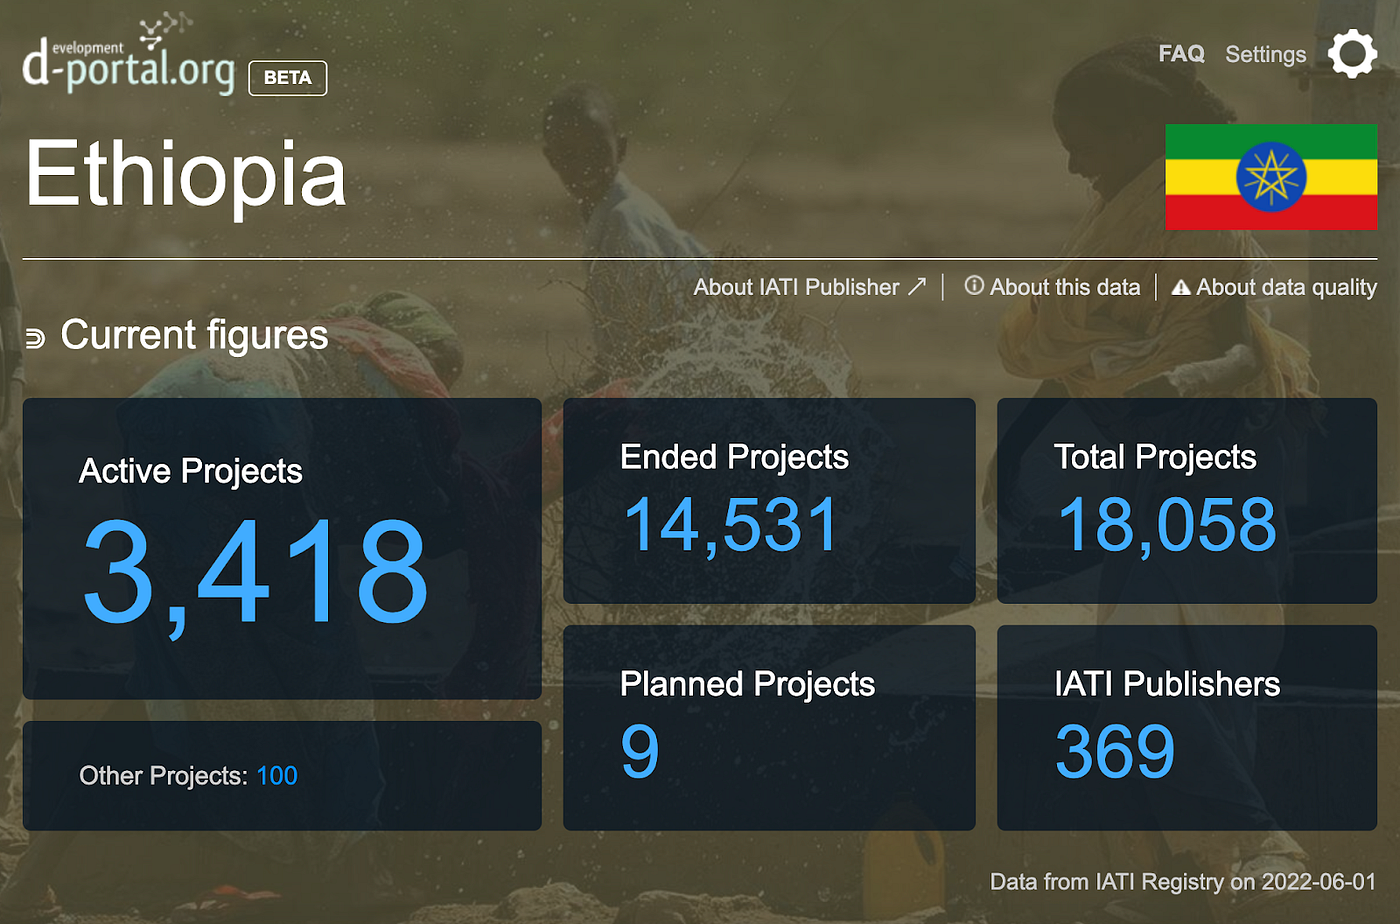
On top of this, d-portal provides simple visualisations that show where aid has come from, and sectors the aid has been spent in.
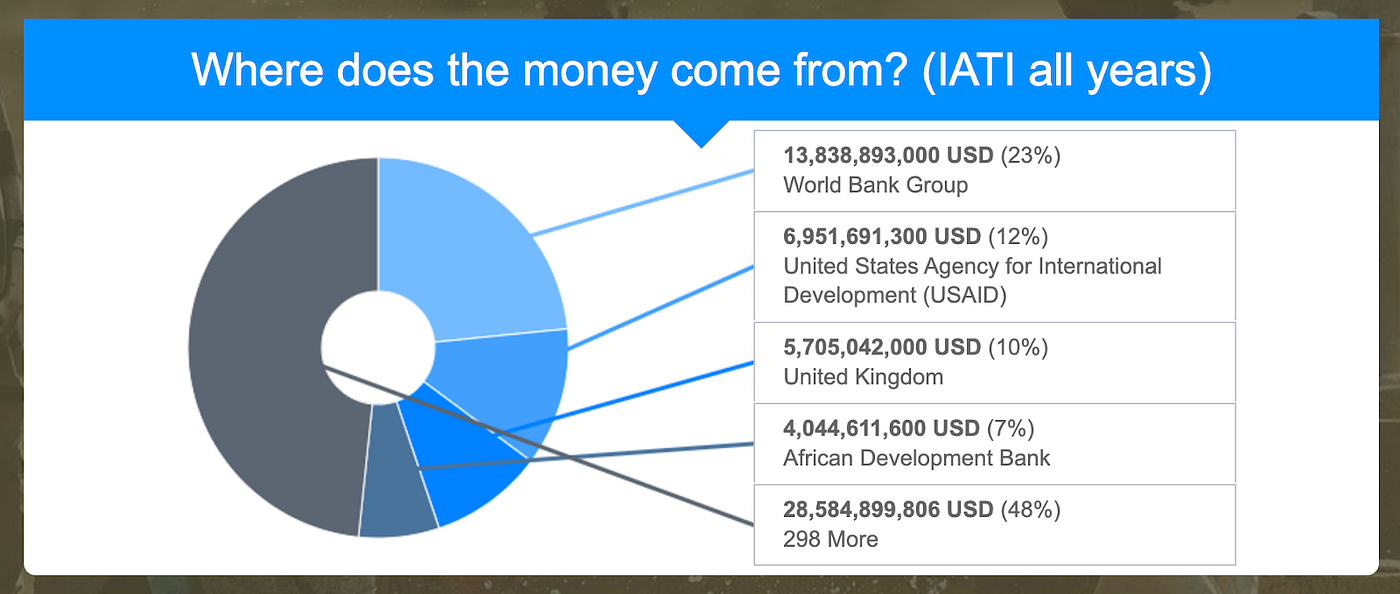
A visualisation from d-preview using IATI data to show where aid money to Ethiopia has come from.
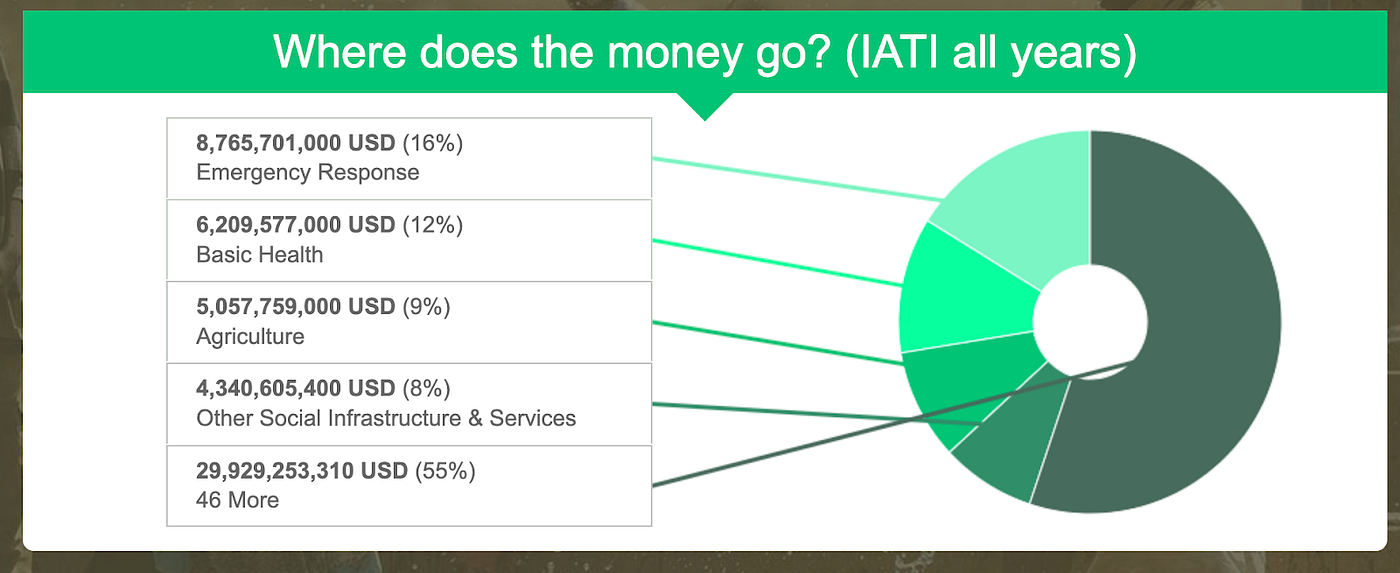
A visualisation from d-preview using IATI data to show where aid to Ethiopia has been spent.
While d-portal was created to help people work with published IATI data, we found it to be a useful way to help organisations prepare to publish data, too. By showing people what their data will look like when it’s published, we build understanding of what this data looks like, and how it can be used.
As we began to understand the value of this pre-publication use of d-portal, we realised that this was important data infrastructure for publishers that needed to be supported. And so, with the help of the team at WetGenes (who maintain the d-portal codebase) we decided to build d-preview.
d-preview uses the same interface as d-portal, but makes clear that the data being represented is temporary, unpublished, test data. It’s also hooked up to our data conversion, exploration and validation tool CoVE, enabling users to generate previews as part of their data conversion workflow.
One year on
Thanks to our partners at Wet Genes, we’ve taken a look at the past year of usage of d-preview, to get some interesting insights about the size, scope and frequency of its use.
Since its launch, d-preview has processed a total of 1,757 previews of IATI data amounting to 10 gigabytes of data. Interestingly, that is just about the same size as the currently published IATI data (11 gigabytes).
d-preview has a constant visit of about 320 per day, with the most number of visits on a single day being 614. From this, there’s a constant number of instances of uploaded data for preview at 7 per day with the most number of previews at 37 on 16th December 2021.
On the 21st March 2022, someone previewed an XML file that was 141 Mb in size — we hope this was intentional. The largest size of a preview, on an average day, is about 3.5 Mb. The most amount of previewed data in a single day is 675.5 Mb.
These numbers are a real testament to d-preview, and show that publishers find it useful to preview their IATI data before publishing. According to Michelle Levesque, Senior Project Manager at the International Organization for Migration:
“d-preview is a valuable and integral tool we use as part of the pre-publication process. It allows the reviewers, who are not familiar with the IATI schema, to see what the data will look like once the data is released.”
What comes next
At Open Data Services, we’re proud to support this kind of infrastructure that helps to make open data useful, usable and in use. As the numbers from d-preview show, for a niche tool d-preview is surprisingly active.
Around IATI, and other data initiatives we work on, there are a growing number of community-led tools, services and utilities such as this. We’re really interested to understand how these can be supported, adopted and maintained to help achieve the wider aims of transparency.
Steven Flower, IATI lead at Open Data Services, will be speaking about how we can continue to support d-preview sustainably at the IATI Virtual Community Exchange on June 28th. Sign up to attend the session.
